
DashboardGPT is an AI-powered visual BI workspace for teams without a data team. Ask a question about your data in plain English and get an interactive chart, KPI, table or written insight, with no SQL, field pickers, or chart builder. Every answer lands on an infinite canvas where you keep investigating with follow-up questions, so the whole analysis stays visible in one place. Key Features and Functionality: Conversational Analytics: Ask questions the way you would ask a colleague. DashboardGPT writes the query, picks a suitable chart, and returns the answer as a chart, number, table or short written insight. Infinite Canvas: Answers appear as movable, resizable objects rather than fixed dashboard tiles. Duplicate them, frame related charts in labelled sections, add text notes, and filter or edit any chart. Follow-Up Questions: Select a chart and ask "compare this with last year". The follow-up builds on the conversation so far and is linked to the chart it came from. Build a Canvas in One Step: Point DashboardGPT at a new dataset, and it lays out a canvas of headline figures, trends and breakdowns to start from. Bring Your Own Data: Upload CSV or Excel files. On the Team plan, connect Google Sheets, Google Analytics and Search Console, refreshed on a schedule. DashboardGPT profiles every upload (column types, distinct values, ranges, and which columns are measures, dimensions or dates) so you can start asking straight away. Warehouse connections are coming soon. Scheduled Email Reports: Send a canvas to your team every day, week, or month with an AI-written summary, each chart as a small table, and the whole canvas as a PDF. Anyone can email a canvas to themselves in one click. Share and Publish: Export a canvas as a PDF, publish it as an Apache Superset dashboard, and control access with owner, editor, and viewer roles. Bring Your Own AI Key: Managed AI is included. Organizations that prefer their own provider can connect OpenAI, Anthropic, Azure OpenAI, Google or any OpenAI-compatible endpoint, with usage billed to their own account. Apache Superset Under the Hood: Queries run through Apache Superset, a proven open-source analytics engine. Primary Value and User Solutions: Getting answers from business data usually means finding the data, learning the schema, writing SQL, building charts, and assembling a dashboard. DashboardGPT shortens that to Ask, See, and Explore: ask a question, see a visual answer, and keep investigating without losing context. It supports sales, marketing, SaaS, finance, operations, and product analytics. Try the live demo with no sign-up, start on the free Explore plan, or take a 15-day Team trial.
DashboardGPT
DashboardGPT is conversational visual analytics that turns natural-language questions into interactive charts, insights, and visual analysis on an infinite canvas.
Introduction
Information
- PublisherDashboardGPTDashboardGPT
- Websitewww.dashboardgpt.org
- Published date2026/11/13
DashboardGPT Alternatives & Similar Tools
Looking for something different? Compare these Business tools to DashboardGPT.
WritingBusinessProductivityDevelopmentAudio & Music
DeepL
Details
DeepL is an AI-first translation platform offering high-quality text, document, and real-time voice translation with enterprise-grade security and API access.

DirectoriesBusinessMarketingProductivityDevelopmentDesign
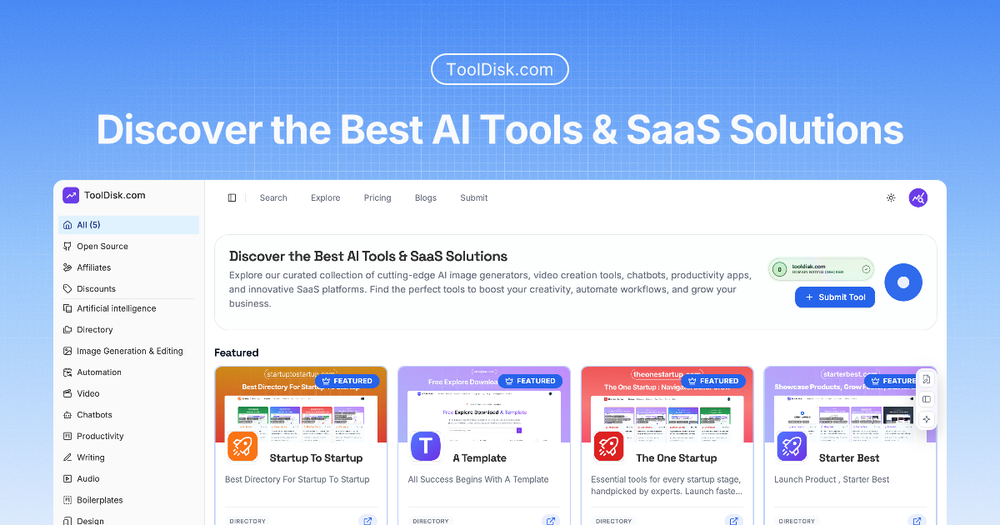
ToolDisk.com
Details
A curated directory to discover the best AI tools, image generators, video creation software, productivity apps, and SaaS solutions for creators and businesses.
Tooluck Weekly · every Monday
New AI tools and agent skills, once a week
The tools added to Tooluck that week, the newest skills for Claude Code, Codex and Cursor, and one side-by-side comparison. No spam, unsubscribe anytime.