
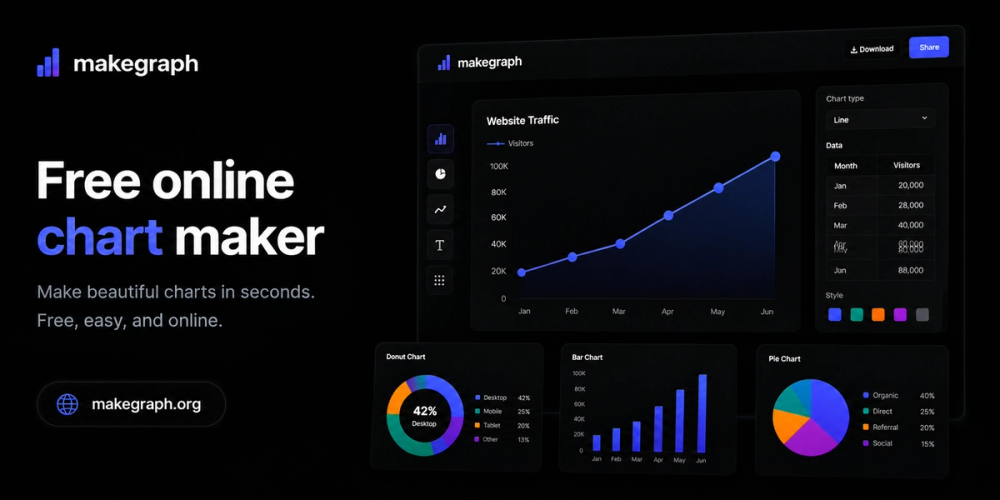
MakeGraph is a streamlined online tool designed for rapid data visualization. It allows users to transform spreadsheet data from Excel or CSV files into professional charts within seconds. The platform supports a variety of formats including standard bar, line, and pie charts, as well as more specialized visualizations like animated bar chart races and stacked bar charts.
Key Features
- Instant Visualization: Upload or paste data to generate charts in under a minute.
- Multiple Chart Types: Create bar charts, line charts, pie charts, double bar charts, and animated races.
- High-Quality Export: Download results instantly as PNG or SVG files for use in reports or presentations.
- No Barriers: Completely free to use with no signup or registration required.
- Customization: Easily adjust labels, colors, and data sets to match specific branding or reporting needs.